Web Thermometer
Measure and store temperature and relative humidity and display in the browser.
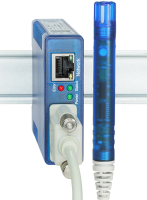
Step 1: Startup

Step 2: You’re off and running
-
Read temperature directly in the browser
Temperature and humidity values can be displayed directly in the Web browser
-
Display temperature curve in the browser
Use the ability to view the measured values directly in the Web browser in graphic form
-
Data logger in the browser
Query contents of the data logger by a mouse click in the Web browser
-
W&T Cloud Service
In addition to local saving in the internal logger, the Web-Thermometer also supports saving in the cloud:
-
Visualize live values using Java applet
By using the integrated Java applet and the sample page pre-installed in the unit, measured values can be displayed and automatically refreshed up-to-the-minute.
-
Step 3: Integration into your system
-
Switching digital outputs when limits are exceeded
Turn on an indicator lamp when a limit is exceeded by 25°C. If the temperature is back to the valid range, turn the indicator off again.
-
Keep an eye on temperatures with email notifications
Send a notification when limits are violated or timer-based via email, directly to the responsible technician.
-
Incorporate temperature values via OPC server
Use the W&T OPC server to collect temperature data from the device and forward them to your client application.
-
Evaluate measured values using SNMP managers
Use polling to integrate the measured values into your SNMP manager or have alarm/info traps sent.
-
Write temperature and humidity values to a database
Use the W&T "Sensobase®" tool to save measured values directly to a database.
-
Create graphics using RRDtool
Automatic creation of graphics on Unix/Linux based systems.
-
Send limit violation notifications via TCP client
Receive alarm messages from the sensor using your own TCP server applications.
-
Reduced data load in the network by using UDP polling
Poll measured values with just one UDP packet, thereby keeping the data load in the network low.
-
Manage alarm and system info messages via Syslog
Evaluate measured values using the Syslog daemon.
-
Temperature and relative humidity values in the "abaNSM" monitoring system
A complete overview every instant using abaNSM and the W&T Web-Thermo-Hygrobarograph
-
Send measured value to an FTP server and archive them
Automatically write measured values to a file on the existing FTP server.
-
Print display
To print the graphical display of Web Graphs firmware version 1.50/1.39 and higher the Web browser needs special settings for print behavior.
-

-
Exchange the device-internal HTML pages with your own
Create your own presentations using HTML uploads.
-
Temperatures in your own application
The "Thermoguard" complete system - Centralized temperature monitoring in the pharmaceutical industry.
-
Mercury thermometer
Visualize temperatures as a mercury thermometer on a Web page using the Java applet.
-
Retrieve and display multiple measurements using PHP
Acquire measurements from multiple devices and display them on a single Web page using PHP
-
Display measurements in Nagios
Acquire measurements from devices and monitor them in Nagios.
-
Display measurements and states of Web-IOs in Google Maps
Use PHP and JavaScript to incorporate measurements into Google Maps.
-
Publish Web-IO’s in the Internet via DSL
Dynamic IP addresses, NAT and other things you need to know.
-
Wireless link to temperature sensors
Monitoring temperature values using the Web Thermometer over a wireless LAN
-
iPhone-optimized Web pages for Web-IO applications
Display measurement values on the iPhone.
-
Displaying climate data in camera images
with Web-Thermographs and Mobotix camera.
-
Web Thermometer sends push notifications via ntfy.sh
Manual: Limit violations sent to cell phone