Applications for Web-Thermographs:
Display measurements in Nagios

The NAGIOS software running on Linux/Unix operating systems makes it possible to monitor complex IT structures. With the help of the following example Web-Thermographs can also be incorporated into the system.
For this example you need a Linux/Unix PC with Nagios software installed. You also need the Nagios plug-ins, since these contain the command check_snmp for the SNMP query. The PC must have a Web server and an SNMP daemon.
Preparations
You have already provided your Web-Thermograph(s)- with power,
- connected it to your network,
- assigned it an IP address - which with WuTility is no problem.
- installed Nagios and the Nagios plug-ins on your PC
1. Activate SNMP
For the Web-Thermograph to be queried with SNMP, this function must first be enabled in the unit:

2. Configure NAGIOS
If NAGIOS is correctly installed on your PC, you can go to the Web page: http://<rechnername>/nagios
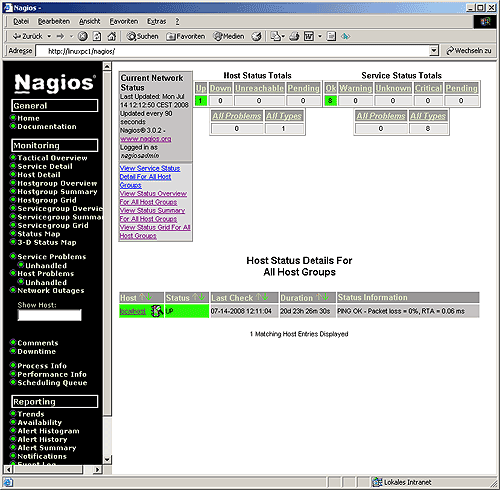
to find the start page of NAGIOS. First only the status of the local host is displayed.

3. Create configuration file
- For the Web-Thermograph to be represented in NAGIOS, a configuration file must be created. This is usually stored in the directory
/usr/local/nagios/etc/objects. - Create a file named thermo.cfg
- First a definition for the device and a device group must be created:
			define host
				{
				use                generic-host
				host_name          webgraph
				alias              Web-Thermograph
				address            192.168.0.12
				hostgroups         wut_devices
				check_command      check-host-alive
				max_check_attempts 3
				}
			define hostgroup
				{
				hostgroup_name     wut_devices
				alias              WuT Devices
				members            webgraph
				}
The most important parameters here are the IP address of the device and the host name which you want displayed in NAGIOS. The names of the group and the alias names will become visible in NAGIOS later.
To query the device via SNMP, a corresponding command must be created which uses the plug-in check_snmp to retrieve the measurement from the unit:
			define command
				{
				command_name       check_57610
				command_line       $USER1$/check_snmp -H $HOSTADDRESS$ -o 1.3.6.1.4.1.5040.1.2.8.1.3.1.1.1
				}
The command named check_57610 retrieves the measurement using SNMP and the corresponding SNMP-OID.
No a service must be created which executes the command created above:
			define service
				{
				use                 generic-service
				host_name           webgraph
				service_description SNMP-Request
				check_command       check_57610
				}
Once all the definitions are stored in the file thermo.cfg, NAGIOS must be made to load this file as a configuration at startup.
Open the file /usr/local/nagios/etc/nagios.cfg and insert the path to the file created above into the list of configuration files:
			(...)
				# You can specify individual object config files as shown below:
				cfg_file=/usr/local/nagios/etc/objects/commands.cfg
				cfg_file=/usr/local/nagios/etc/objects/contacts.cfg
				cfg_file=/usr/local/nagios/etc/objects/timeperiods.cfg
				cfg_file=/usr/local/nagios/etc/objects/templates.cfg
				cfg_file=/usr/local/nagios/etc/objects/thermo.cfg
				(...)
4. Display the measurement
- Restart NAGIOS.
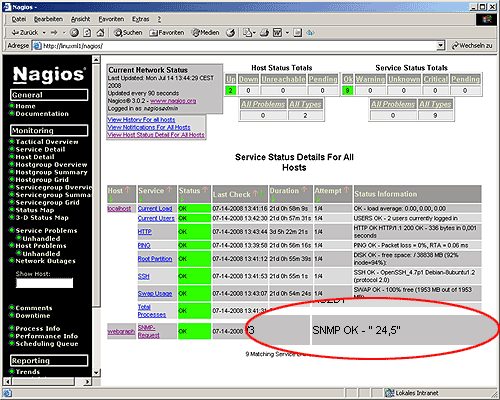
- On the Service Status page the Web-Thermograph is now displayed with the current temperature.

No problem: We’ll send you the Web-Thermograph Pt100/Pt1000 at no charge for 30 days. Simply fill out the sample order form, and we’ll ship the Web-IO Analog-In for testing on an open invoice. If you return the unit within 30 days, we will credit the invoice in full.
To sample orders