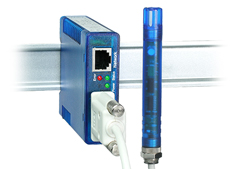
Document measurement data online
Measure and visualize temperature, relative humidity and air quality

Continuous availability everywhere
Continuous documentation of the measurement data in the online memory enables access to the measurement data anytime and anywhere.
Automatic documentation
The W&T Web Service makes long-term automatic documentation of measurement data possible. No more time-consuming recording and loss of important measurement data.
Individual visualization
Views can be individually created and charts and measurement curves combined as desired.
Current graphs from different locations can be conveniently compared with each other, discrepancies quickly noted and views shared with other cloud users.
-
Here’s how it works:


Connect W&T Web-Graph to the network
- Install sensor
- Connect power supply
- No configuration on the device is necessary since it is automatically given access to the network via DHCP and can connect to the cloud service.
Measuring data local or online
- Measurement values are stored directly on the sensor and can be viewed when needed in the browser (without the cloud). Limit violations are reported and indicated on the LED ’traffic light’ of the device (Web-Graph Air Quality model only).
- Optionally you can automatically send the measurements from the device to the W&T cloud, save and document them there and report limit violations.
-
Then simply:

![]()
More details:
- Data sheet Web-Thermometer Air Quality
- Data sheet Web-Thermo-Hygrometer
![]()
Feedback with colleagues, family and friends via e-mail.
![]()
See a live example: wutcloud.de
(Guest access with actual measurement values)
Don’t guess: Test now!
Do you have questions about the cloud or about climate measuring via network?
Our technical team is available to answer questions on Mon.-Fri. from 8:00 a.m. until 5:00 p.m. at: +49 202 / 2680-110.

