Application for rule.box:
Monitor network components
The rule.box as IP watcher

Monitoring your network components: In Part 1 of our tutorial you will learn how to make availabilities visible via light signal. Part 2 provides a guide for setting up messages with a device cannot be reached.
You activate the video function using the following button, whereby you use the provider Google and (at your own risk in terms of data protection ;) share data with it.
You activate the video function using the following button, whereby you use the provider Google and (at your own risk in terms of data protection ;) share data with it.


What you’ll need:
No problem: We will be glad to provide you with a rule.box for 30 days at no charge. Simply fill out the sample order and we will send the rule.box for testing on open account. If you return the device within 30 days we will fully credit the invoice.
To sample ordersAll the steps:
1 Creating the basic flow (video Part 1)
2 Setting up the dashboard display (video Part 1)
3 Messaging when no response (video Part 2)

1. Create the basic flow (video Part 1)
-
Open the Node-RED editor.
-
Menu item Import takes you to the local library of your rule.box. Select the pre-installed subflow "WuT-Ping.json" and import it.
-
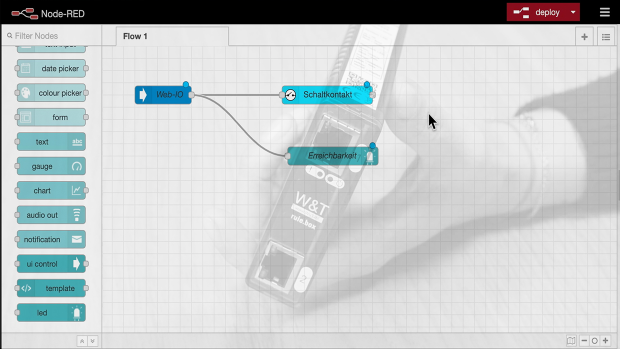
Drag the imported connector from the left border to the workspace and configure it by double-clicking. Enter the name of the device you want to monitor and as host its IP address.
-
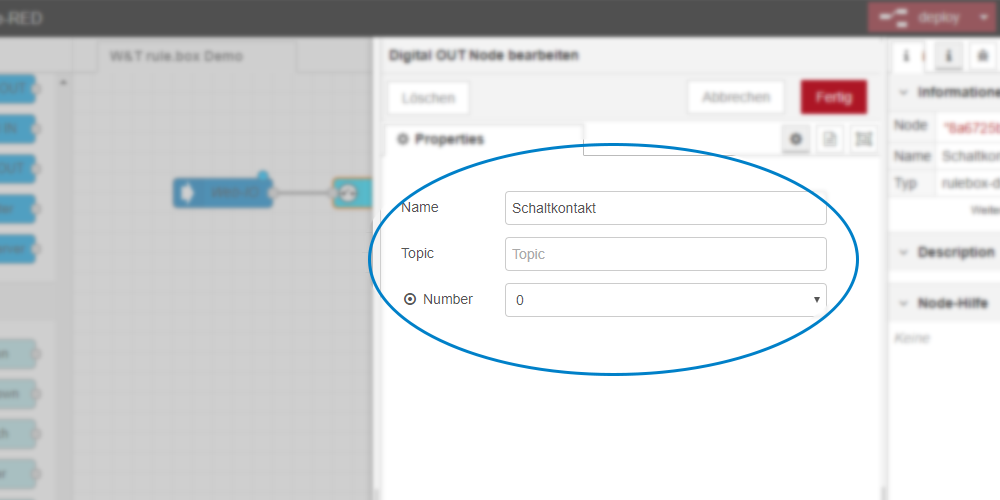
From the rule.box nodes select the node "Digital OUT" and add it to your workspace. When configuring you can also give this node a name and specify the desired output.
-
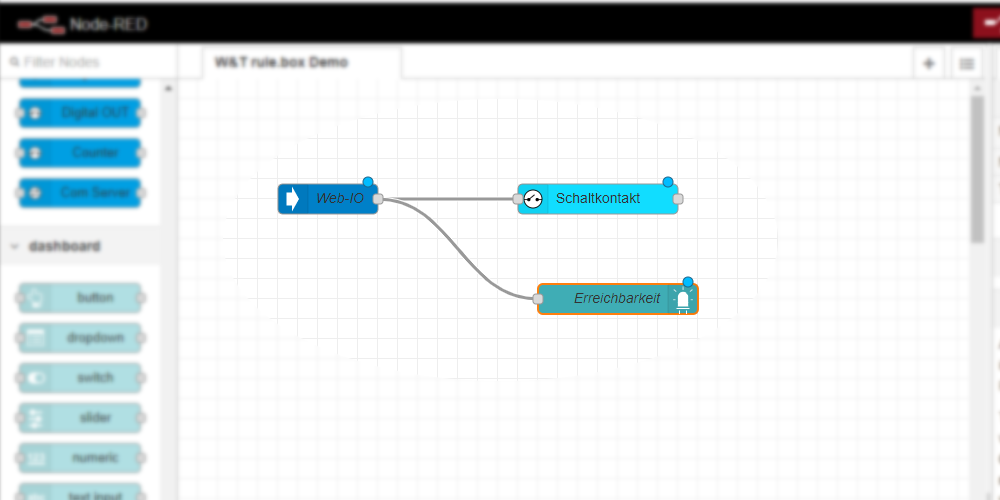
Connect the two nodes.
2. Set up the dashboard display (video Part 1)
-
In the menu select Manage Pallet. Under "Install" search for "led" and install the node "node-red-contrib-ui-led".
-
Drag the "led" node from your node library to the workspace. In the configuration window insert a new ui group which you can name for example "IP Monitor". Fill in the fields for Label and Name.
-
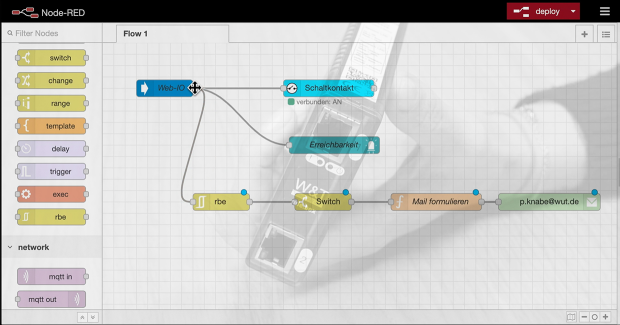
Now you can also connect the LED node to the ping node.
-
Confirm with deploy.
-
If the Web-IO can be reached, i.e. the output on the rule.box is switched, both the LED on your rule.box and the corresponding display on your dashboard will come on.
3. Message for no response (video Part 2)
-
In the menu select Manage Pallet. Under "Install" search for "mail" and install the node "node-red-node-mail".
-
Drag the "email" node, which has its link on the left side, to the workspace. In the configuration window enter a recipient address as well as the mail server and the user data for the sender.
-
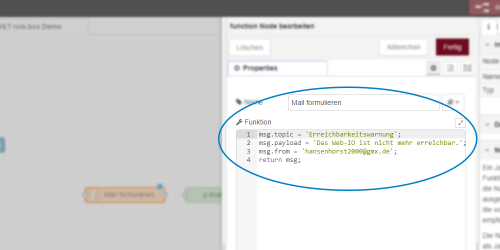
Add a "function" node and configure it by giving it a name and setting the following functions:
										msg.topic = ’e-mail subject line’;
										msg.payload = ’e-mail contents’;
										msg.from = ’sender address’;
										return msg;
-
Add a "switch" node for defining a condition that will trigger an alarm. In the configuration area beneath Properties select "is false" as a value rule.
-
Now you also need an "rbe" node. This ensures that an e-mail is only sent when there is a status change. In the configuration menu under "Mode" select the pre-set option "block unless value changes".
-
Now link the nodes to your workspace one after the other and finally confirm with deploy.
